Business Etiquette Around The World: Asia & Western Europe

global-business-etiquette-asia_531f0dab542a6

TFF-M2BusinessEtiquetteWEurope

These two very interesting infogrpahics shed some light into the cultural differences that exist in “business etiquette” around the world. From religion, to hierarchies, to face-to-face negotiations, diplomacy and rank; this infographic take’s a deeper look into the interactions business professionals should be keenly aware of when conducting world-wide business. Since, we live in a global economy, it’s to be expected that one will encounter a person of a different cultural background. Even for the everyday individual, these graphics can break stereotypes, generalizations and barriers that prevent optimal inter-cultural communication. With  e-commerce now dominant world-wide, being able to communicate effectively to a diverse demographic is a must among organizations. Information like this is a must-see for business-minded individual.

Sources

http://www.visualistan.com/2014/03/business-etiquette-around-world-asia-infographic.html

http://countrycode.org/business-etiquette-around-the-world-western-europe.html

The High Cost of Multitasking

20140410-154739.jpg


The topic of “multitasking” is one of many controversial topics surrounding the current “hyper connectivity” era we live in. This infographic takes critical look at the downsides to multitasking.  I want to preface by stating, I don’t agree with the graphic, and personally love multitasking. However, this graphic states that multitasking costs the global economy $450 billion annually. I’m not sure how true these statistics are, but the graphic states that it is the distractions, and inability to complete tasks on time that cause them to frown upon multitasking. What they term “the distraction economy” is plagued by the average person checking their phone 150 times per day, and taking 25 minutes  to complete a task after being interrupted. To me this seems like an attack on Millennials, by those who have failed to adapt to the “new” global economy. I also find it hard to believe that in a business setting one can go without multitasking to any degree. I do agree that there are certain times when an individual should devote their full attention to a task, but I do not agree that multitasking will equate to a drop in IQ by any means.

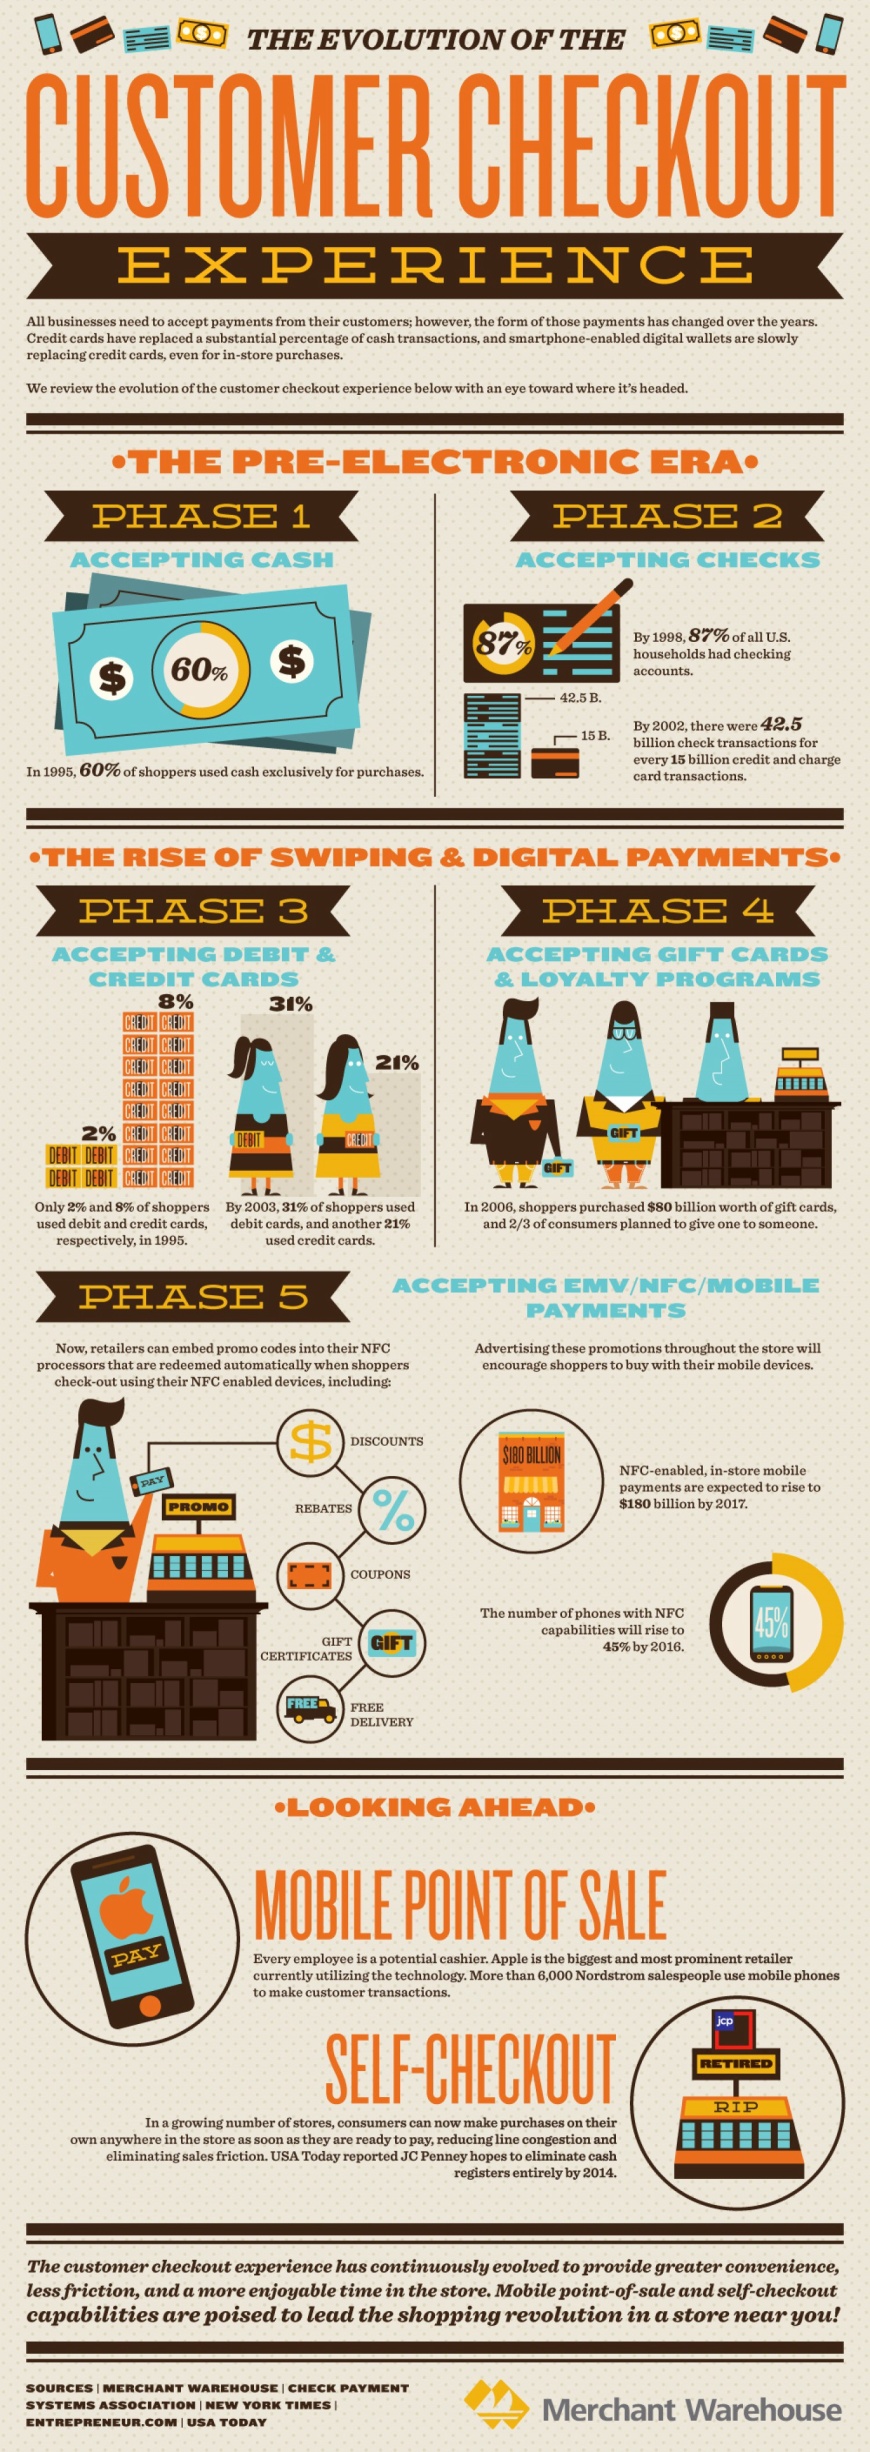
The Evolution of The Customer Checkout Experience

image


In this infographic by “Merchant Warehouse” they take a deeper look into the evolution of the “customer purchasing experience”. What was once a simple cash transaction has now become either a: credit, debit, gift card, or even most recently a mobile transaction. It is interesting to see how far the consumer world has come in accommodating for purchasing goods and services. Just even 5 years ago, purchasing goods online was still a stressful task,  but today not only can consumers participate in e-commerce, but use their cellphones as “cash” as well. I personally love the invention of the self-checkout machine and use it whenever I can. I love seeing how far technology can take the world, but wonder what any risks or downsides would be to such “high-tech” forms of payment.

Which U.S. Brands Are Spending The Most on Advertising?

Image

This infographic by KISSmetrics outline America’s “biggest” advertisers. This list seems reasonable to me. Although, I was surprised that L’oreal and Kraft Foods are not higher on the list. I can recall seeing many “KD” commercials that were so rampant all over television. As well L’oreal (who owns both Garnier , Maybelline as well as other brands) has a lot of  advertising, given it’s marketing beauty products. Nonetheless it is sometimes interesting to get an inside look into what “your competitors” may be doing that you’re not! I find this graphic both informational, and visually appealing. It is a known fact amongst all business professionals, that advertising is one of the most important aspects of business. Finding out how much; however, was what I found appealing. I’m curious to know roughly how much (percentage wise) of these businesses profits are devoted towards advertising ?

Forbes 2012 Billionaire Facts and Figures

Image

While I usually do not look at the Forbes lists, I ran across this is extremely visually appealing infographic and had to take a look. I wasn’t surprised to learn that Bill Gates at $76 Billion, is still the richest man in the world. However, I  was surprised to learn that the youngest billionaire is a 24 year old Hong Kong women. The graphic also presents a pie chart, which shows the percentages of the biggest populations of billionaires worldwide. I was not surprised that the biggest populations China, Russia, and U.S had a higher number of billionaires. The graphic displays other predictions, and statistics about billionaires around the world. What I found most interesting is that they list Michael Kors as a “first time” billionaire. In my opinion, this displays the true power of branding, and how far it can really take and individual in life. 


Source 

http://visual.ly/2014-forbes-billionaire-facts-figures

Getting Ahead in Business With Body Language- Gengo

Image 

This infographic discusses how body language affects business transactions. The graphic outlines several interesting facts about body language, and even provides tips on different aspects of business communications. I think the graphic is well made, and a must-see for all business professionals. 

How Mobile is Changing Business

how-mobile-is-changing-business-sm

This infographic by KISSmetrics,  breaks down how mobile phones are becoming a more prominent consumer tool to purchase products. While,desktop usage by computer is still relatively high, the amount of people shopping on mobile devices and tablets has increase exponentially. Businesses should now expect that consumers want to “purchase on the go” and have to accommodate accordingly. I am noticing that more and more websites are beginning to have “proper” mobile websites. By this, I mean a website where a consumer can view the product or service and make a purchase securely, right from their mobile device or tablet. I personally, have started to use these methods more and more lately as it ‘s convenient for me when I am on the go. I feel like smartphones are becomes so advanced that very soon they will replace “traditional” computer systems, I just wish more companies would have readily accessible mobile sites that make sense and are are visually appealing, because it is now a component companies cannot just “overlook”.

Why Facebook Is Blue: The Science of Colors in Marketing- Article

I found a link to an interesting article which expands on the idea of colors within business branding. The author of the Article Leo Widrich, states that Facebook is “blue” because the create Mark Zuckerberg is red-green colorblind. This was information I was shocked to hear about and found interesting. Mark was quoted as stating: “Blue is the richest color for me; I can see all of blue.” The article then proceeds to visually show how powerful color is in brand recall. I was surprised I recognized the particular “block” of Facebook blue among the other high contrast colors. The article also uses KISSmetrics’s infographic on color, I recently posted, providing input on what common colors “say” about the business. Later the article quotes KISSmetrics graphic on colors and gender stating: “women love: Blue, Purple and Green. Women hate: Orange, Brown and Gray. Men love: Blue, Green and Black. Men hate: Brown, Orange and Purple.” I find this type of information invaluable and something that a company can review continuously, as I believe colors can also shift with the generations, and thus requires constant up-to-date knowledge.


Link to Article


http://blog.bufferapp.com/the-science-of-colors-in-marketing-why-is-facebook-blue


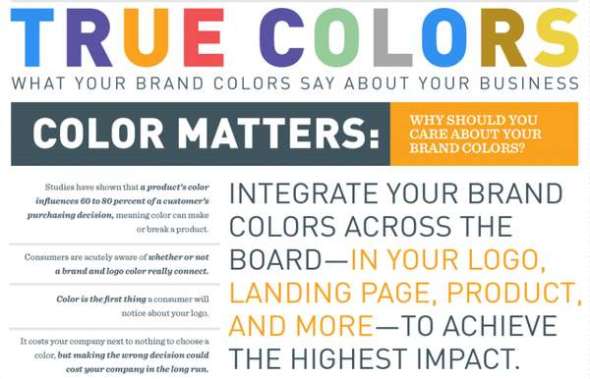
True Colors- Infographic

Image


I came across another visually appealing infographic in regards to Colour and branding. Since, I feel Colour it such an important aspect of business branding I felt justified in dedicating another post to this topic. In this graphic, they state that 60-80% of a consumers purchasing decision is dependent on colour and this can make or break a product. When Apple released their White Iphone 4, I was super impressed with the design and “expensive” appearance of their new model, eventually purchasing that model. I feel like in this case “changing/adding colours” did not work against the company. However, If Mcdonalds was to become “blue” for whatever reason, I would most definitely not respond the same way. In this way, I feel like colours within business branding is a subjective topic and is dependent on a number of factors within the company. Since this infographic states it costs a company “next to nothing” to chose a colour to brand themselves with, choosing wisely will determine the profitability of the company in the long run. 

How Do Colours Affect Purchases?

color-purchases-sm

Kissmetrics is a website that contains many really visually appealing infrographics on business related topics. This particular graphic centres on how colour affects the way consumers purchase their products. The post states that 93% of consumers focus on visual appearance when purchasing a product, another 85% of these individuals state that colour is a heavy influence on their purchase. The whole idea is that colour increases a brands “recognition”. I associate blackberry with black, Apple with white and black, Mcdonalds with red and yellow ect. This can seem nonsensical, but the idea is that the quicker a consumer can recall you brand, or associate with something as common as a colour, the better. This infographic expands further, by breaking down the details on some common colours, as well as anyalyzing other concepts such as “power words”. This graphic is a must see for any individual associated with the “business world”.

Source

http://blog.kissmetrics.com/color-psychology/